How do satellites detect climate change?
Multi-spectral satellites measure Earth's surface temperature (land or sea) using passive remote sensing in the thermal infrared (TIR) portion of the electromagnetic spectrum. They detect the natural heat radiation emitted by the surface and atmosphere, which serves as a proxy for temperature. This is essential for climate change monitoring because it provides consistent, near-global coverage of Land Surface Temperature (LST) and Sea Surface Temperature (SST) over decades—filling gaps in sparse ground-based networks and enabling detection of long-term warming trends, heatwaves, urban heat islands, and ocean-atmosphere interactions.
Multi-spectral sensors (like those on Landsat, MODIS, VIIRS, Sentinel-3 SLSTR, or AVHRR) typically have a handful of discrete bands across visible, near-infrared, shortwave infrared, and especially TIR wavelengths (unlike hyperspectral sensors with hundreds of narrow bands). The TIR bands (usually 2–5 channels in the 8–14 μm “atmospheric window”) are the key for temperature sensing.
Step-by-Step Process
- Emission of Thermal Radiation
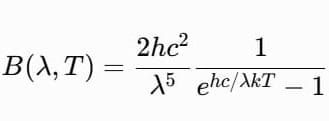
Earth’s surface (and atmosphere) emits infrared radiation as a near-blackbody. Hotter surfaces emit more (and peak at shorter wavelengths) per Planck’s law. For typical Earth temperatures (~250–320 K), peak emission occurs in the 8–13 μm TIR range.
The spectral radiance ( B(\lambda, T) ) for a perfect blackbody is
the formula in the picture above,
where ( h ) is Planck’s constant, ( c ) is the speed of light, ( k ) is Boltzmann’s constant, ( \lambda ) is wavelength, and ( T ) is temperature. Real surfaces have emissivity ( \epsilon < 1 ) (they emit less than a blackbody). - Satellite Detection
The sensor (e.g., push-broom scanner with quantum well infrared photodetectors (QWIPs) or micro-bolometer arrays) measures top-of-atmosphere (TOA) radiance in specific TIR bands (e.g., Landsat TIRS: 10.6–11.2 μm and 11.5–12.5 μm; MODIS bands ~11 μm and 12 μm).
The measured radiance includes:- Surface-emitted radiation (modified by emissivity ( \epsilon ))
- Reflected downwelling radiation from the sky/atmosphere
- Upwelling atmospheric emission/absorption (mainly water vapor, CO₂, aerosols)
Clouds are first masked using other spectral bands (visible/NIR) because they block the surface signal.
- Conversion to Brightness Temperature
The raw radiance is inverted using Planck’s function (or a simplified approximation like the Stefan-Boltzmann law ( E = \sigma T^4 ) for broad-band) to compute brightness temperature—the temperature a perfect blackbody would have to emit the observed radiance. This is not yet the true surface temperature. - Atmospheric and Emissivity Corrections
This is the critical (and most complex) step. Multi-spectral TIR bands enable accurate corrections:- Split-window algorithm (most common for 2-band sensors like AVHRR or basic MODIS): Uses differential absorption between two close TIR bands (e.g., 11 μm and 12 μm) to estimate and subtract atmospheric effects (mainly water vapor). The difference in brightness temperatures between the bands is proportional to atmospheric interference.
- Temperature-Emissivity Separation (TES) (for 3+ TIR bands, e.g., MODIS/VIIRS advanced products or planned missions): Simultaneously solves for temperature and emissivity using the spectral contrast (minimum-maximum difference) in the bands. Emissivity varies by surface type (e.g., high for water/vegetation ~0.98; lower and more variable for bare soil/rock).
- Atmospheric profiles (from weather models or other satellite sounders) or radiative transfer models further refine the correction.
- For SST over oceans, additional adjustments convert “skin” temperature (top ~10 μm of water) to bulk temperature if needed.
- Output Products
The result is LST or SST at pixel resolution (e.g., 1 km for MODIS, 100 m for Landsat TIRS, 500 m–1 km for SLSTR). Products include daily global maps, time series, and anomalies. Uncertainty is typically 0.5–2 K, depending on conditions (best over oceans at night; higher over heterogeneous land).
Role in Determining Climate Change
- Long-term records: Instruments like AVHRR (since ~1981), MODIS (2000–present), and SLSTR provide multi-decade consistent datasets. These reveal global warming trends (e.g., rising SST/LST), marine heatwaves, and regional hotspots.
- Global coverage: Satellites observe everywhere (including remote areas like Antarctica or oceans), complementing in-situ buoys/stations.
- Complementary data: Combined with microwave radiometers (for all-weather/cloud-penetrating SST or atmospheric temperature profiles) and reanalysis models for “all-weather” products.
- Applications: Track essential climate variables (LST/SST), drought, evapotranspiration, urban heat, ice melt, and model validation. Data show satellites reliably capture temperature variability and trends similar to ground measurements.
Limitations include cloud interference (only clear-sky data), variable emissivity over land, and the fact that satellites measure surface/skin temperature (highly correlated with but not identical to air temperature at 2 m). Ongoing missions and cross-calibration between satellites improve accuracy for climate records.
Multi-spectral TIR sensing turns invisible heat radiation into precise, scalable temperature maps that have become indispensable for quantifying and understanding climate change.